Observations for the Last 365 Days 10 Mar 2026 12:05:10
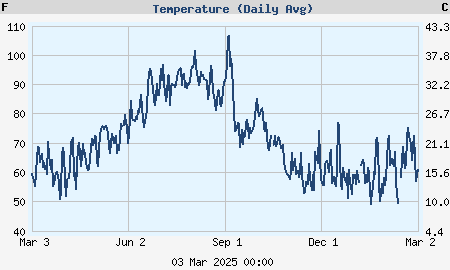
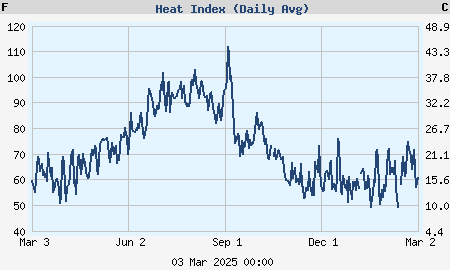
| High Temperature | 96.7 F |
|---|---|
| Low Temperature | 39.4 F |
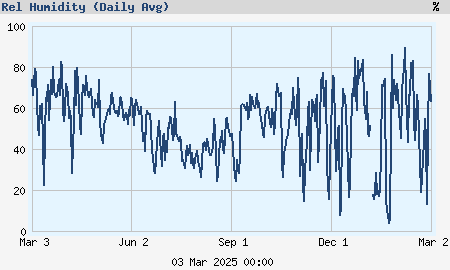
| High Humidity | 95 % |
| Low Humidity | 9 % |
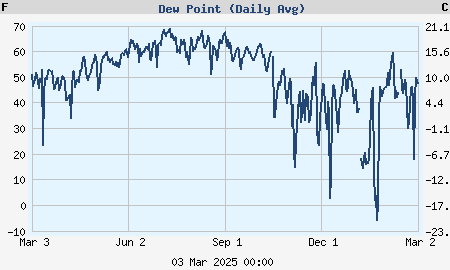
| High Dew Point | 63.1 F |
| Low Dew Point | 11.1 F |
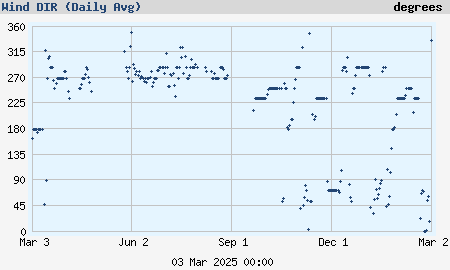
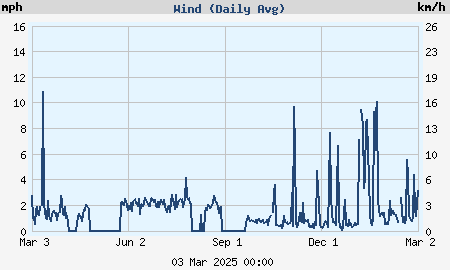
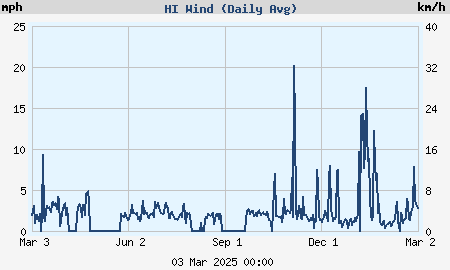
| High Wind Speed | 29.0 mph |
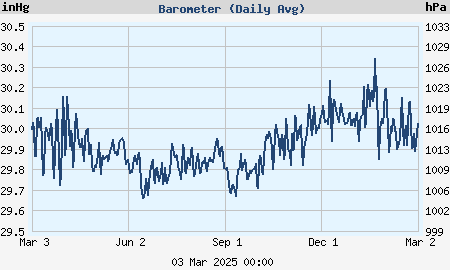
| High Barometer | 30.404 in |
| Low Barometer | 29.679 in |
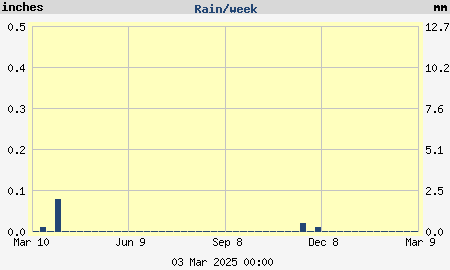
| Rain Total | 0.08 in |
| High Rain Rate | 0.12 in/hr |
| High Heat Index | 94.9 F |
| Low Wind Chill | 39.4 F |